|
The STRATEGIC NEWS SERVICE® N E W S L E T T E R
15 Years Providing Weekly Foresight
The most accurate predictive letter in computing and telecommunications,
***SNS*** Special Letter: Quantified Health:
A 10-Year Detective Story of Digitally Enabled Genomic Medicine
By Larry Smarr
[Members: Please open the .pdf attachment for best viewing _____
Listen to Mark's latest interview on NPR:
"Tech-Based Security vs. Liberty: The trade-offs in post-9/11 America":
www.kplu.org/post/tech-based-security-vs-liberty-trade-offs-post-911-america _____
and:
The SNS Future in Review conference, now in its 10th year:
See "Upcoming SNS Events & Media Links" for
If you'd like to be more involved in SNS events as one of our select sponsors, please contact Sharon at: sam@stratnews.com or 435-649-3645.
Publisher's Note: This issue may be the most important Special Letter we have ever published. For many of you reading it, it may also save your lives, or extend them.
There is a new approach to health available to anyone, today. Described in this issue, it represents a revolution in the balance of power between patient and today's healthcare systems, putting the former in charge, through a program of regularly gathering personal data.
In this issue, you'll also learn a number of fascinating things about the human body that are just now "coming into the literature," and which are generally unknown.
Finally, there are three very large healthcare issues that author Larry Smarr and I have both discussed personally at length which are completely ignored by today's treatment regimes and which are key to proper health. The first is the simplest: sleep, in the right amount, properly done. Not adhering to this practice probably cuts years off of lives today, with the victims never having had a clue what happened.
The second is almost as obvious: as a Stanford-trained biochemist, I have never understood the idea of healthcare without attention to food. What you eat is the most important, and the first, input into good or improved health. Addressing your daily food intake should be the first work your doctor does in treating you. (I'll cover the third major shortfall in my summary.)
Twenty years ago, a friend I'll call Tom had just survived a head-on car collision. He'd lost his spleen, and the sight in one eye from hitting his head on the dash i.e., from brain damage. At the time that we met, his doctor had given up on his sight returning (it had been a few weeks), and, Tom said, he had literally been unable to sleep since the crash. I looked at the biochemistry and found that the same amino acid needed for nerve repair was also a precursor to serotonin, necessary for sleep. Tom's body seemed to be coming up short. I suggested some foods with high content of this amino acid, and he agreed to try. Within 24 hours he was sleeping normally, and his sight returned shortly afterward. Today he is a leading architect in Seattle.
These problems, and their improper treatment, are common.
I hope, by reading Larry's incredible piece, they will become less so; you will be the better for it. mra.
___
Towards Digitally Enabled Genomic Medicine: A 10-Year Detective Story of Quantifying My Body
By Larry Smarr
This is a report on my 10-year personal quest to increasingly quantify my body. As a lifelong scientist, this form of understanding my physical being has come naturally to me.
In many ways, my personal journey is a detective story. It started with simple quantification, such as weighing myself every day; but then clues began emerging which caused me to dig deeper and to rapidly expand the biochemical variables I was tracking over time. Eventually, I made a completely unexpected discovery about myself, with serious future health ramifications. But rather than jump to that surprise twist, I will describe the journey I experienced step-by-step, in the belief that hearing about the evolution of my understanding may benefit others.
What I have learned about myself both illustrates and foreshadows the ongoing digital transformation of medicine[1]. As our technological ability to "read out" the state of our body's many subsystems improves, keeping track of changes in our key biochemical markers over time will become routine, and deviations from norms will more easily reveal early signals of disease development.
Genome sequencing is exponentially decreasing in cost, allowing for much broader population sequencing, leading to a digital context for comparison of our individual body's markers. Social networks enable sharing among people with similar health situations[2] in a way that was virtually impossible until recently, increasing the positive reinforcement of better personal health choices. Finally, the emergence of system biology is leading to an integrative approach for all this data.
As mentioned above, I have been engaged in an ongoing personal experiment[3] in probing this emerging paradigm. This report is a short summary of my quest a report from the field on the coming radical changes in how we can monitor and improve our personal health status.
» Nutrition, Exercise, and Sleep: The Foundations for a Healthier Self
According to the American Medical Association,[4] in the years 2007 and 2008, nearly three-quarters of American males were either overweight (40%) or obese (32%). This percentage has greatly increased in recent decades[5].
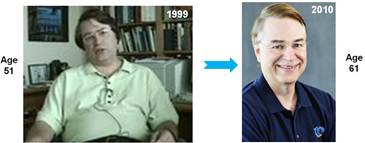
After spending 20 years in Illinois, in the epicenter of the obesity epidemic, I clearly had been swept up in this trend (Fig. 1, left). Soon after arriving in La Jolla, California, in 2000, a number of my California mentors suggested that I start exercising regularly. I was easily convinced, and also began exploring nutrition and keeping daily track of my weight my first step into what I came to think of as "quantifying my body." Fortunately, as a professor at UC San Diego, I was able to find an experienced trainer who was very patient and knowledgeable about balancing weight training with increasing my aerobic exercise. Simultaneously, I started reading dozens of books on weight loss.
What gradually became clear to me was that one should think not in terms of weight loss as a goal, but rather think of altering your food intake to better match the biochemical systems of your body. The sub-components of our food (protein, fats, carbohydrates) and their ratios drive not only our digestive system, but much of our complex hormonal system which communicates to all organs of the body[6].
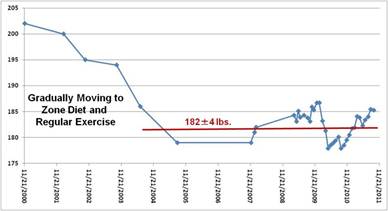
After changing my nutrition to more of the "Zone" approach, introduced by Barry Sears (described further below), and increasing my exercise, I lost 20 pounds over four years (Fig. 2)[7]. However, note that this is only 5 pounds per year, or 1 pound every 10 weeks. The only reliable way to see if you are in a long-term downward weight trend is to keep a log of your daily or weekly body weight and better yet: graph it.
Note that once I got to my desired weight of 182 pounds, I moved up and down by 4 pounds around this average, over the last seven years. I can tune my weight by incrementally increasing my weekly caloric burn and decreasing my caloric intake. From the chart, it is clear that I will be doing that this fall...
The Zone is a caloric restriction approach whose goal is the lowering of cellular inflammation by a balanced diet with a caloric split of 40% low glycemic carbohydrates, 30% lean protein, and 30% omega-3 enriched fat. I eat about half of a typical American restaurant serving for each meal. To see how well I was meeting Zone goals, I began quantifying my food intake. For 12 days in 2010, each time I was home all day (not necessarily on consecutive days), I measured each ingredient, in grams or teaspoons, that went into the food I ate, and converted each item, using the U.S, Department of Agriculture website,[8] into total calories and grams of protein, fat, carbohydrate, sodium, sugar, and fiber (Table 1). For the few items that were commercial products not on the USDA site, I entered the data from the product label.
On every day of the 12 days measured, I added the totals, and then averaged them to get a typical daily food intake profile (Table 1). Using 9 calories per gram of fat and 4 calories per gram of protein or carbohydrate, my 12-day test revealed a personal calorie profile of 40% carbohydrates, 26% protein, and 34% fat. So I still needed to lower the fat by 4% in favor of protein to exactly match the Zone profile I was trying to achieve.
I must say, the numbers in Table 1 surprised me. My total caloric intake (yes, including the wine) is approximately 1,440 calories. The American Dietetic Association estimates that the average 60-year-old American male ingests about 2,100 calories per day. My caloric intake, therefore, is 30% lower than that of the average male my age, essentially putting me into the "caloric restriction" category, which has been shown in many species to extend lifespan[9]. In spite of my lower caloric intake, I eat very well: I love gourmet food restaurants and good wine. However, I have none of the more than 500 12-ounce sodas, or the more than 40 pounds of high-fructose corn syrup, the average American consumes per year. (More details on my eating tips are contained in my previous short note to FiRe[10].)
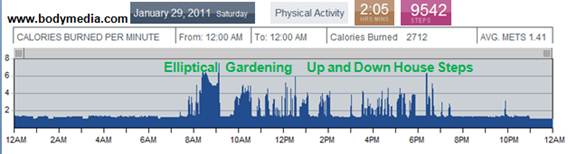
My primary explicit exercise is on the elliptical machine (zero impact preserves my knees and ankles), and free weights or weight machines with a trainer. However, by using devices that quantify caloric expenditure, I've found that by varying daily routines one can make a great deal of difference in one's daily caloric burn. I have used both simple pedometers (I use Omron's) and the BodyMedia arm band. The BodyMedia device measures skin temperature, heat flux, galvanic skin response, and three dimensions of acceleration. Then, using algorithms, it converts these data into calories burned per minute. After exercise, when you plug the BodyMedia device into your PC's USB port, the BodyMedia software uploads your data over the Internet onto its storage servers, where its website graphs the physical progression of your day.
As you can see in Fig. 3, for a typical day, while my elliptical work accounts for the biggest block of caloric burn, gardening and household chores add up as well. Note that 2,000 steps is roughly 1 mile so on the day shown in Fig. 3, I did the equivalent of walking nearly 5 miles (9,542 steps).
I have stopped using the elevators in my six-story Calit2 building, and I try to turn meetings into "walk and talks," each hour of which adds about 6,000 steps to my daily routine. After making these changes, over a six-month period I averaged about 7,000 steps, or 3.5 miles, per day. By the way, on a typical day of just sitting at a computer and only walking downstairs to eat, I walk only about 1,000 steps. The obvious conclusion: You need to get out of your routine to walk more and exercise.
The results of my trainer's and my measurements show that I doubled my strength and tripled my daily steps over the last decade. However, one puzzle remains for me. My food quantification (Table 1) shows a daily caloric intake of 1,440 calories; and BodyMedia says my average (over 25 weeks) daily caloric burn is about 2,500 calories. With that large a difference between my calorie intake and caloric burn, I should be losing weight continuously. Instead, as shown in Fig. 2, my weight is steady, if fluctuating.
I am not sure how to resolve this.
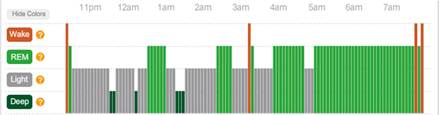
An even bigger unknown to most people than the minute-to-minute caloric burn of their bodies is the nature of their sleep during the night. I had no idea what mine was like or how important good sleep is to health. Fortunately, the Zeo consumer device (www.myzeo.com) enables you easily to quantify your sleep. A simple headband is wirelessly connected to an alarm clocklike device, which polls your status every 30 seconds to determine whether you are awake, in light or deep sleep, or in dream REM (rapid eye movement) sleep.
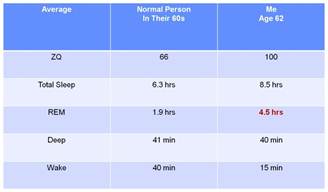
Fig. 4 shows what I have discovered to be my typical sleep pattern: a few REM blocks (green) in the first half of the night, and then a long REM block from roughly 4am until awakening. The first thing this told me is that waking up early cuts into my REM in a way I hadn't realized before. Also, the length of sleep is critical to what Zeo computes as one's "ZQ" a score of the quantity and quality of one's sleep each night.
Because Zeo, like BodyMedia, uploads all of its users' data into a common Internet storage system, it can easily compare your nightly data with its thousands of other users, sorted by age. As can be seen in Table 2, while I have the same amount of deep sleep as an average person in their 60s, my REM sleep typically accounts for over 50% of my total sleep.
This is much more like an infant's sleep pattern than an adult's. Combined with my longer sleep duration, this makes my ZQ much higher than average. I have recently been using the Zeo to measure the effect of jet lag by taking it with me on global trips. It appears to take at least four days after arrival for my normal sleep pattern to re-establish itself.
» Your Blood Is a Window into Your Well-Being
Realizing the efficacy of quantifying my weight, what I eat and drink, my exercise, and my sleep, I started quantifying my blood chemicals. I began to see the blood as a "window" into the well-being of many of my organs, much as Lee Hood, president of the Institute for Systems Biology, has argued[11]. It is amazing how many variables one can measure with a simple blood draw. In Lee's envisioned future, a pinprick of blood reads out the state of 50 key chemicals in 50 organs (2,500 markers); in today's world, however, I must have 3 to 12 vials of blood drawn to get the approximately 60 markers I track (Table 3). I have blood tests[12] four to eight times per year and keep a spreadsheet with all the values. This allows me to look for trend line changes over years and to spot changes from average, as we will see below.
I had no idea that blood samples can reveal whether you need to take vitamin D, if your liver and kidneys are in good shape, if your zinc or molybdenum levels need supplementing, or if you have mercury contamination; today, however, I routinely use food and supplements to "tune my numbers" to more optimal levels. For instance, when
blood tests showed that my vitamin D had dropped to 30, I took vitamin D3 supplements till my tests showed it had come back up to 50. I must say I am not nearly as comprehensive as Ray Kurzweil[13] (who takes 250 supplements a day), but I do believe that my program has greatly improved my health over what just eating well and exercise had done.
Reducing your body's silent inflammation
Because I was following the Zone diet, the first chemical values I wanted to check were the balance between omega-3 (found in salmon, olive oil, and flax seed) and omega-6 (found in corn oil, mayonnaise, and sunflower seeds) fatty acids, which influence our body's inflammation through our eicosanoid signaling hormones[14]. Omega-6enriched foods as a precursor to eicosanoids are generally pro-inflammatory; omega-3's products are more anti-inflammatory. Our bodies can't make these essential fatty acids, so the amounts and balance of these fats in a person's diet will affect the body's eicosanoid-controlled functions, with effects on cardiovascular disease, blood pressure, and arthritis.
Our genes were largely selected over millions of years of hunter-gatherer life, when we walked 10 miles a day and ate lots of fruits, nuts, and leaves. Studies have shown that the ratio of omega-6 to omega-3 fatty acids in the blood of hunter-gatherers was about 1:1, whereas the average American has a ratio of greater than 20:1. This over-consumption of omega-6 foods is a major driver of inflammation, which in turn drives obesity and heart disease. Given that many healthful foods contain[15] both omega-3 and omega-6 fatty acids, and that few foods are pure omega-3, I have supplemented my food with pharmaceutical-grade[16] fish-oil pills for the last five years.
The only way to tell if I was correctly balancing my omega-3 and omega-6 intake, and therefore the inflammation level of my body driven by their ratio, was to get an omega blood test. However, my healthcare provider did not offer such blood tests, so I started using the online service offered by Your Future Health (www.yourfuturehealth.com). YFH will arrange for you to go to a local facility that draws blood, and then mails you the results.
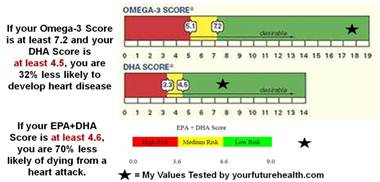
Fig. 5[17] shows the results of my YFH omega-3 blood test, which is a good measure of one's risk of future heart disease caused by inflammation. The omega-3 test measures the long-chain fatty acids[18] EPA and DHA (both typically found in fish-oil pills), as well as ALA, and the omega-6 arachidonic acid (AA) found, for example, in egg yolks. The "omega-3 score" (top bar in Fig. 5) is the sum of EPA, DHA, and ALA. The stars indicate my blood values for the omega-3 score, the DHA score (second bar in Fig. 5), and the EPA+DHA score (third bar in Fig.5). All indicate that I have greatly lowered my risk of future heart disease compared with most Americans.
This was encouraging, but what I really wanted was what Barry Sears calls the "gold standard" for measuring the level of the body's silent inflammation: the ratio of AA to EPA, directly comparing blood levels of omega-6 to omega-3. Chronically ill patients can have an AA-to-EPA ratio in the range of 15-40. The average American has ratio of around 10. The ideal[19] is 1.5, but you are in good shape if it is as low as 3. My YFH blood test showed that my AA/EPA ratio varies between 1.3 and 1.7. The Japanese population, with its high intake of fish, has an AA/EPA ratio of 1.5. So I found that I was nearly ideal in my lack of silent inflammation driven by omega-6 eicosanoids.
Changing your cholesterol levels
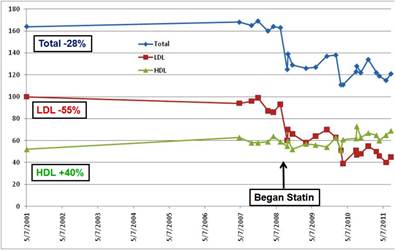
Next I focused on cholesterol, given its widely discussed role as a predictor for future coronary disease. Fig. 6 is a graph of my total cholesterol (blue), my "bad" low-density lipoprotein (LDL) cholesterol (red), and my "good" high-density lipoprotein (HDL) cholesterol (green).
When I started my program in 2000, my bad cholesterol was twice as high as my good cholesterol.
As you can see in Fig. 6, over the five years (2000-2005) in which my weight loss and diet/exercise adjustment occurred, I experienced about a 20% increase in my HDL, but
my LDL and total cholesterol were virtually unchanged. My cardiologist suggested that I try a "whiff of statins" 10mg of Crestor three times a week. By keeping quantitative track of my blood samples, I could see a dramatic lowering of my LDL and total cholesterol. Encouraged, my cardiologist moved me to 10mg daily, and I saw another drop in LDL. The end result was that my LDL fell by 55% (currently 45), my HDL rose by 40% (currently 70), and my total cholesterol dropped about 30% from my 2001 levels. Essentially, I went from a state in which my LDL was twice my HDL to a state in which my LDL had halved, and my good cholesterol HDL was now 50% higher than my bad cholesterol.
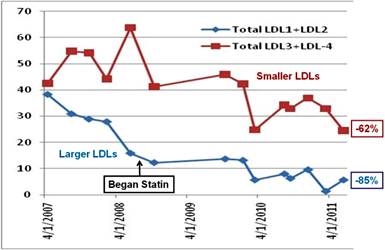
More important than lowering your LDL as a whole is lowering the number of LDL particles that are small enough to lodge in the walls of your arteries as plaque. These are not routinely screened for, but my cardiologist asked me to take a more comprehensive cholesterol test (also known as "vertical auto profiles," or VAPs) which measures the blood concentration of four size ranges of LDL (LDL1, 2, 3, and 4). The smaller ones LDL3 and LDL4 are more dangerous. As you can see in Fig. 7, a quantification and graphing of these lipoproteins, I have dropped the smaller (LDL3 + LDL4) levels by 62%, and the larger (LDL1 + LDL2) by 85%, from their highest levels before I started taking a statin.
Measuring your risk of future coronary disease
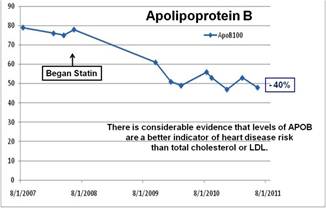
Lowering your LDL, particularly the smaller LDL particles, is correlated with reducing your risk of heart disease. But I also test several chemicals that aren't routinely asked for by doctors, but which clinical research has shown to be even better indicators. Two such measures are triglycerides (TG) and apolipoprotein B (ApoB), one of the variables in a complete blood test of one's cholesterol state. ApoB is responsible for carrying cholesterol to the tissues.[20] Although there is considerable evidence that ApoB is a better indicator of heart disease risk than LDL, ApoB is less tracked. Fig. 8 shows that I have lowered my ApoB by 40% since I began taking the statin.
What is called the "single most powerful lipid predictor of extensive coronary disease"[21] is the ratio of one's TG to one's good HDL cholesterol. TG value is related to dietary levels of sugar and high-glycemic carbohydrates.[22]
The American Heart Association states that you are at high risk if your TG level is 200 to 500 mg/dL. One-third of Americans have TG levels above 150 mg/dL. The American Heart Association recommends a TG level lower than 100mg/dL.[23] Because I rigorously avoid sugar and eat only low-glycemicindex carbs, my TG level is in the low 30s. When my ultra-low TG level is combined with my reasonably high HDL level, I get a ratio of 0.5. The average American has a ratio over six times higher (about 3.3); a ratio of 4 or greater means one is either pre-diabetic or has active type 2 diabetes. Thus, all my cholesterol numbers imply that I should have a very low level of plaque formation in my arteries.
From the tests described earlier, a reasonable hypothesis is that my body is in a very low state of inflammation and that my chances of future heart disease also are very low. However, as a scientist, I have learned that it is always best to measure other variables to test a hypothesis.
» "Come Back When You Have a Symptom"
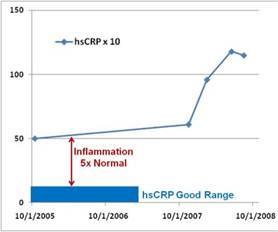
To do this, I started tracking another key blood marker, C-reactive protein (CRP), using a high-sensitivity test (hsCRP). CRP is the generic blood marker used to measure inflammation,[24] and it should be less than 1 mg/L. But as can be seen in Fig. 9 (in which I have multiplied the value of my CRP reading by 10), my CRP never dropped below 5 (or 50, in the units I use) in three years. I had discovered that my body is chronically inflamed just the opposite of what I expected!
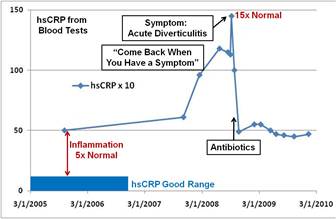
Even more intriguing: after I had been tracking my CRP for two years, I noticed that it had suddenly more than doubled[25] in less than a year. Troubled, I showed my graphs to my doctors and suggested that something bad was about to happen. The doctors asked, "Do you have a symptom?" I said that no, I felt fine, but pointed out that the graph clearly showed my body's inflammation was building up, and something bad must be driving it. Their response was: "Time series charts like this are 'academic' and not useful for clinical practice," telling me to "come back when you have a symptom."
Within a few weeks of this exchange on September 20, 2008 I experienced a sudden, severe pain in my left abdomen, perhaps the worse persistent pain I have ever known. When I got to the hospital, I was told that I was having an attack of acute diverticulitis, and was prescribed 10 days of strong antibiotics. Fortunately, I had taken a blood sample two days after the attack, allowing me to extend the graph in Fig. 9 to create Fig. 10.
Fig. 10 shows the sudden spike in the CRP inflammation and the rapid CRP decrease after taking the antibiotics. The attending medical professional said, "If the diverticula are inflamed and you don't treat it with antibiotics, it can lead to a perforated gut, which could kill you within days." Clearly, my medical professionals were not interested in the use of early-warning time series of blood markers to predict such events.
Soon thereafter, however, I noticed (Fig. 10) that my CRP only fell back to the level five times the desirable upper limit not within the blue bar height, which would indicate a healthy situation. Studies have shown that a CRP greater than about 3 mg/L doubles[26] the relative risk for coronary events, yet mine was not dropping below 5. This increase occurs because chronic inflammation is a major co-factor with LDL in the formation of arterial plaque. This co-creation means that even if your LDL is low, if your CRP is high you can still have unhealthy levels of plaque formation[27].
So, I realized that it was time to quantify the growth rate of plaque thickness in my arteries. An easy clinical measure of the thickness of arterial plaque is an ultrasound analysis of the carotid artery in the neck. Because this artery is so large and near the surface, ultrasonography not only accurately images the artery's cross-section and the rate of blood flow, but this modality also directly measures the thickness of plaque on both sides of the artery.
My cardiologist prescribed this test every two years. The two tests in October 2008 and October 2010 showed that the carotid artery plaque had grown in thickness by 12% on the left side and 24% on the right in spite of my low LDL and low TG/HDL ratio. Evidently, the inflammation measures associated with food intake (specifically the ratio of omega-3 to omega-6) are independent of whatever was causing my CRP to stay at elevated levels and spike to high values.
» A Personal Medical Detective Story
I was very puzzled at this major paradox arising from my numbers. On the one hand, I had switched to a very anti-inflammatory diet, took fish-oil supplements, and increased exercise, all of which should drive me to a very low level of inflammation. Yet my CRP marker showed that I was in a state of chronic inflammation that was correlated with a dramatic increase in my plaque thickness. Reflecting on this, I realized something must be out of balance in my inflammation system, and driving a pro-inflammatory reaction in spite of my having an anti-inflammatory diet.
I suspected my colon, because it had been my "weak spot" over much of my life, so I started taking stool tests[28] at the same time I took blood samples. At this point, in 2008-2009, I was taking the stool sample merely to obtain more and different data. I didn't realize that this simple process of gathering more data would lead me deeply into the study of the human immune system, genetic polymorphisms, and the discovery that I had an incurable chronic disease.
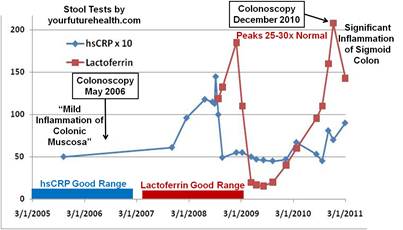
As with most men my age, I underwent a colonoscopy every five years. I requested my 2005 written colonoscopy report, and it noted I had "a mild inflammation of the colonic mucosa and moderate diverticular disease." When I looked at the results of the Your Future Health stool test, I noticed a new set of markers that measured inflammation and immunologic status. One of these markers was lactoferrin, which I learned was a glycoprotein shed from the surface of neutrophils[29], the most abundant type of white blood cells, which attack bacteria during inflammation. Normally, the lactoferrin value should be less than 7.3 (the inside red bar in Fig. 11). For instance, my wife and oldest son have a value less than 0.5. Imagine my surprise when I found that my lactoferrin level was 120, and repeatedly peaked over several years at 200, which is 25 to 30 times as high as it should be (208 vs. 7.3) and 400 times the lactoferrin value for my family.
Furthermore, the lactoferrin level seemed to rise and fall (Fig. 11) in my quantified stool sample as my CRP rose and fell in my quantified blood sample. Without graphing these digital markers at overlaid time series, I would never have detected this situation by staring at spreadsheets. I didn't have any macroscopic "symptoms" other than occasional rectal bleeding, which my doctor had attributed to internal hemorrhoids.
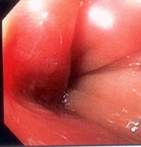
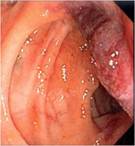
Armed with my graphs and the fact that it had been five years since my last colonoscopy, I was able to obtain another colonoscopy in December 2010. To maximize data precision, I asked the doctor to take images of any regions he thought appeared abnormal. This time the medical report was much worse than it had been five years earlier:
The patient has extensive diverticular disease of the left colon, associated with ischemia of the sigmoid colon and hemorrhoids. He has extensive [five years earlier "moderate"] diverticular disease and, at this time, he has also developed significant inflammation of the colonic mucosa [five years earlier, "only 3-4 areas of mild inflammation and some redness (erythema)"], with areas of ischemia, with submucosal hemorrhage, edema, and marked swelling of the membrane, which narrows the lumen.
As you can see from the photos he took (Fig. 12a,b), the inflamed areas in my sigmoid colon (12b) are in sharp contrast to the rest of my colon (12a), which was normal. In particular, many of the actual diverticular orifices are not inflamed, but the surrounding tissue is inflamed. At the right of photo 12a you can see what is termed an "inflammatory pseudopolyp."
A Google search of the medical research literature showed that highly elevated fecal lactoferrin is one of the most
definitive markers for differentiating inflammatory bowel disease (IBD) from other forms of colon irritation.[30] Specifically, IBD[31], which affects 1 million Americans, has two major subclasses: Crohn's disease (CD) and ulcerative colitis. Both of these subclasses[32] are chronic, incurable autoimmune diseases.
Naturally, I was reluctant to accept this logical inference from my quantification project, especially when told by my colonoscopist that he did not believe I had IBD. If I did, he said, he "would have seen it" when he carried out my colonoscopy a procedure he had been doing for decades. Presented with the evidence of my graphs of the definitive lactoferrin marker, this doctor also dismissed them as "academic." I was detecting a pattern...
Fortunately, a decade ago I became involved with a startup medical information company, MedExpert, which uses artificial intelligence and expert opinion to identify top doctors in the world and to provide continual physician assistance to support medical decisions related to any medical condition. MedExpert found that one of the top IBD research specialists in the world Dr. William J. Sandborn, previously of the Mayo Clinic had just last year been appointed the new chief of the GI Division in UCSD's School of Medicine.
Dr. Sandborn has published time series of lactoferrin as a marker for IBD flare-ups,[33] and his graphs are quite similar to mine above. I was in a different HMO than UCSD's HMO in La Jolla; without describing all the complications of insurance and referrals, which MedExpert provided invaluable assistance in navigating, I was eventually able to get an appointment with Dr. Sandborn. We agreed to redo the colonoscopy, although it had been only six months since my previous one, but this time to not only take pictures but also perform multiple biopsies.
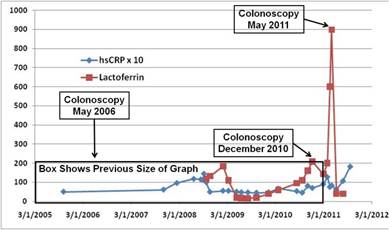
In May 2011, when this colonoscopy took place, I had taken a stool test and a blood sample two days prior, as is my protocol. I experienced the most copious rectal bleeding I have ever had at the time I took the stool sample. Amazingly, I also found that my lactoferrin had jumped (Fig. 13) from its previous "highs" of about 200 up to about 900 nearly 2,000 times the value my family had! This high level (around 1,000) is the level typical of what are called IBD "active flares",[34] as opposed to the much longer periods of remission (this pattern clearly occurs in my graph in Fig. 13).
From the combination of lactoferrin markers, the colonoscopy with accompanying biopsies, and a follow-up magnetic resonance enterograph, Dr. Sandborn concluded that I was indeed likely to have late-onset CD, currently confined to the sigmoid colon. Without my time series of lactoferrin, it is unlikely I would have discovered my internal condition, especially because only 5% of CD patients are diagnosed[35] after age 60.
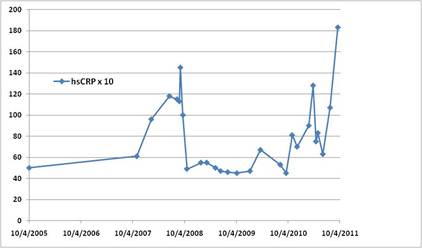
Just as I was finishing this article, I received my latest (September 20, 2011) hsCRP blood result. My CRP had risen to 18.3, the highest in my six-year time series (Fig. 14). Three years ago, when my CRP spiked to 14.5 (Fig. 10), I had my "acute diverticulitis" attack within two days of the spike.
As of now, a week after my CRP reading of 18.3, I feel fine, but I am on alert and keeping track of where nearby hospitals are when I am traveling. Once again, I've come to understand that I can't count on either intuiting or "feeling" the quantitative state of my body's key markers.
Once I had come to terms with this diagnosis, I began to wonder what had caused it. I knew that IBD was considered an autoimmune disease and that it had some genetic component. So I decided to dive into quantifying and analyzing my DNA.
» Know Your Genetic Polymorphisms
I was an early adopter of consumer genomic analysis. I sent my saliva to www.23andme.comand Navigenics in 2008. These services reveal one's single nucleotide polymorphisms[36] (SNPs), sites along your DNA where single base pair changes occur in at least 1% of the general population. These services look at over 500,000 SNPs of the full 3 billion base pairs in human DNA. One can search their databases for a specific condition; I searched for Crohn's after my diagnosis and was surprised at what I found.
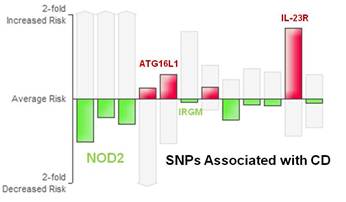
The SNPs that have been linked with Crohn's disease in genome-wide association studies (GWAS) are pulled together by 23andme, and in Fig. 15 the length of the bars indicate the risk factor compared with that of an average male of European descent. The height of each bar varies from individual to individual. You can see that an important gene (NOD2) associated with CD is showing reduced risk (green bars) from the average for me, whereas I have an 80% increased CD risk (tall red bar in Fig. 15) with the rs1004819 SNP[37] located in my interleukin-23 receptor (IL-23R) gene. In recent years, a number of discoveries on the relationship between IL-23 a key cytokine receptor gene in the important pro-inflammatory IL-17/IL-23 axis[38] and CD have been published[39]. Dr. Sandborn is pioneering[40] the potential use of monoclonal antibodies to suppress the over-expression of IL-23, but these are still in early clinical trials.
The colon is constantly producing both anti- and pro-inflammatory agents, which form a dynamic equilibrium. However, if one has an SNP such as my pro-inflammatory IL23R one, the system can over-express inflammation. The hyper-complexity of the human immune system prevents me from getting into much detail, but it was clear that I had a genetic pre-disposition to colonic inflammation; the question was what would signal the body to activate this autoimmune reaction. The literature[41] suggested that the two most likely agents were food allergies and a colonic microbial imbalance.
To check out the possibility of food allergies, I underwent several blood tests for a wide variety of potentially allergenic food and inhalant agents; all the tests came back negative. I also had celiac disease tests for gluten intolerance, but again the tests were negative. This result led me to quantify my colon's microbial ecology.
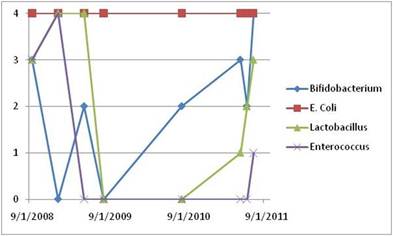
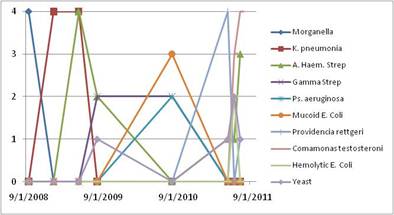
With each of the stool samples I had been taking since 2008, Your Future Health returned a quantitative profile of the "good" and "bad" microbes in my stool. Stool samples allow for culturing of some major families of microbes in the colon. The top part of Fig. 16 shows the four major good microbe families over a three-year period; the lower part of Fig. 16 shows the harmful microbes that appear from time to time. Culturing in Petri dishes leads to a "score" from 0 to 4, with 4 meaning normal abundance and 0 meaning vanishingly small numbers.
The period covered by the graph starts a few weeks before my "diverticulitis attack," after which I was prescribed 10 days of two powerful oral anti-bacterial antibiotics, levofloxacin (Levaquin) and metronidazole. In point of fact, I do not know if I actually had diverticulitis or a CD flare in September 2009. In any case, I started tracking my human microbiota during this period by taking periodic stool samples, which I sent to a lab to be cultured so as to reveal the levels of various microbial families in my gut.
By coincidence, I had collected a stool sample two days after the "diverticulitis attack," but before I started taking the two antibiotics. As Fig. 16 shows, all four of my families of good microbes were at level 3 or 4 before the antibiotics, and only one harmful microbe (morganella) was present.
However, over the few months following the antibiotics, first the Bifidobacterium organisms went to zero, then the Enterococcus went to zero, and finally the Lactobacillus went to zero. Only the E. coli organisms stayed at normal levels. One function of the good microbes is to secrete chemicals that make it difficult for the harmful microbes to flourish. Once my good microbes were lowered, a whole sequence of bad microbes showed up.
During this time, I took a variety of over-the-counter probiotics and prebiotics to help replenish my good microbes, but in 2011, after my large CD flare, I also started taking the more powerful[42] VSL#3. (Whereas most probiotics have doses in the few billions of microbes per pill, my doctor also recommended[43] that I take VSL#3, which has 1/2 trillion bacteria per packet.) Even while taking all these probiotics and prebiotics, I was amazed at how long it took to for my healthy flora to recover followingthe two-week course of antibiotics in 2008 described previously. The bifidobacteria rebounded in two years, but the lactobacilli took nearly three years, and the enterococci are just beginning to recover probably requiring four years to recover fully. It is not clear that I will get back to the original microbial ecological balance I had before the antibiotics.
Whether this major disruption of my microbial community was caused by the antibiotics or the development of the CD inflammation needs further research, but the long time it takes for a normal microbial consortia to repair itself certainly brings into question the routine use of broad-spectrum antibiotics and other drugs. (For instance, does my statin alter the microbial ecology?) Fortunately, in the same time span in which I have been recording my data, the scientific understanding of the human microbiome has been revolutionized by the continuing exponential decrease in the cost of genome sequencing.
In 2005, an important paper in the journal Science revealed in detail that Petri dish cultivation enormously underestimated the diversity of bacterial species in the human gut, since most microbes cannot be cultured in the lab[44].
Following the lead of previous investigators, and instead of relying on cultivation, Stanford University's Paul B. Eckburg and his colleagues looked for a particular genetic sequence (16S rDNA) that serves as a "fingerprint" to identify bacterial species (as well as all living species). The resulting phylogenetic "family tree" these researchers produced revealed nearly 400 different species, primarily divided into two major bacterial phyla, the Firmicutes and Bacteroidetes.
In a paper[45] published the next year, it was shown that "the faecal microbiota of patients with CD contains a markedly reduced diversity of Firmicutes." This was quite intriguing. Is the CD condition causing the alternation of the microbial ecology, or is an altered microbial ecology sparking the autoimmune reaction? Recent years have seen an explosion of the investigation of this "human microbiome" and its critical, previously largely unexplored, role in our body's healthy or diseased functioning. One important driver of this is the very rapid decrease in the cost of genetic sequencing, declining much faster than Moore's Law for microprocessors[46].
In 2006, the first metagenomics sequencing of the human gut was performed on two healthy individuals[47]. The metagenomics technique sequences much of the genome of the hundreds of microbial species, and not just their short "fingerprint" 16S rDNA sequence. This reveals the broad set of genes possessed by the colon's microbiome, the expression of which leads to a set of services performed by the microbes for their host.
By 2010, the journal Nature was able to publish an exhaustive metagenomic study[48] of the human gut microbial population of 124 European adults some healthy and some with IBD which revealed that the microbes in these subjects contained some 150 times as many genes as our human DNA! This study showed that more than 1,000 bacterial species can inhabit our gut, with each of us housing several hundred of these species at any given time. The total number of these bacterial cells in the colon is 10 times the number of human cells in your body. Not surprisingly, the paper concludes that gut microbes "have a profound influence on human physiology and nutrition, and are crucial for human life. Furthermore, the gut microbes contribute to energy harvest from food, and changes of gut microbiome may be associated with bowel diseases or obesity."
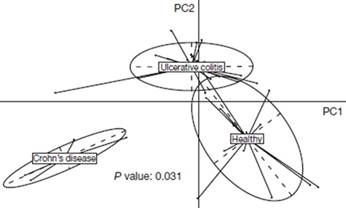
This certainly got my attention. I obviously needed more data namely, a detailed metagenomic analysis of my stool sample, which could then be compared with healthy individuals who did not possess my IL23R SNP. Unfortunately, at this point in my story I have exceeded what is commercially available to a patient, even a fairly persistent one like me. I am therefore working with leading researchers to include me in a human microbiome study. Fig. 17 suggests the kind of information I might learn and is from
the 2010 Nature paper that shows that "bacterial species abundance differentiates IBD patients and healthy individuals."28
Amazingly, the two main variants of IBD CD and ulcerative colitis can be differentiated by the makeup of the patient's colonic microbiome. Not only that, but "IBD patients harbored, on average, 25% fewer genes than the individuals not suffering from IBD, consistent with the observation that the former have lower bacterial diversity than the latter."
In a year, I hope to get the full metagenomic sequencing of my colon microbes to see whether I have reduced bacterial diversity in my microbiome, as the research discussed above would indicate I should. This will allow me to follow over 100 times as many microbes as I have been with culturing tests (Fig. 16). If I can get my full 3 billion base human DNA sequenced, then I will increase the number of bases I have now with my SNPs by 5,000 times. An emerging paradigm would indicate that autoimmune diseases such as IBD might be essentially genetic in origin, but the genetics of both the human host and the colonic microbiome have to be accounted for i.e., if I am to understand my health and disease states, I really do need to get the quantitative data from my complete superorganism self.
» The Interplay Between Your Genes and Those of Your Human Microbiome
Since 80% of the human immune cells are located in the gastrointestinal mucosal walls,[49] the genetic expression of our human DNA is related to that of our microbiome via a highly complex and time-dependent interaction in our GI tract. This has led to the current frontier of research on autoimmune diseases, which tries to understand the complicated interactions of our human immune system and our microbes. I will quote just a few intriguing lines from some of recent scientific literature on this topic.
In 2007, Stanford University's David Relman and Paul Eckburg published[50] on the role of microbes in CD. These authors stated:
"Crohn's pathogenesis may involve a complex interplay between host genetics, immune dysfunction, and microbial or environmental factors.... We review how microbes may participate in the pathogenesis of CD and how they may inappropriately activate the mucosal immune system in genetically predisposed individuals."
In 2009, June L. Round and Sarkis K. Mazmanian wrote[51]:
"Host-microbial interactions in the intestinal environment can down-regulate inflammatory responses.... Importantly, changes in diet, use of antibiotics, and intestinal colonization (e.g., eradication of intestinal helminthes), have likely modified intestinal microbial communities and contributed to the increased prevalence of IBD during the past century."
Finally, in a scientific article published in May of 2011, two Yale University researchers, Clara Abraham and Ruslan Medzhitov, make a statement that links my Figures 15 and 17:
"Associations between IBD and genes that regulate microbial recognition and innate immune pathways, such as NOD2 genes that control autophagy (e.g., ATG16L1, IRGM) and genes in the interleukin-23/T helper cell-17 pathway [see Fig. 15, my SNP chart], indicate the important roles of host-microbe interactions in regulating intestinal immune homeostasis. There is increasing evidence that intestinal microbes influence host immune development, immune responses, and susceptibility to human diseases such as IBD, diabetes mellitus, and obesity."[52]
» What the Digital Revolution in Healthcare Is All About
At this point, I have to leave clinical medicine and join medical research projects if I want to continue my knowledge quest. As I look back over the last decade, it is hard to believe that I started my quantification program by stepping on a bathroom scale every morning and writing down my weight and ended up having to synthesize more than five dozen blood markers, multiple stool markers, microbial population distributions, and a variety of imaging modalities to try to understand the state of my body's health and how to improve it. Yet this is precisely what the digital revolution in healthcare is all about. We tend to think that change is linear, but unrelenting change in information technology, scientific instruments, and nanotechnology is leading inexorably to an explosion of personal data about our bodies and an ability to compare it across our human animal population.
Although I have described my own body, the methods are generally applicable to everyone. Similarly, the interactions between one's individual genetic SNPs, one's blood chemistry, and one's microbiome occur in all of us.
The point of this article is that the combination of trend-revealing graphs of time series of individual biochemical markers, with population-wide comparisons to people with different health outcomes, is transforming biomedical research, and ultimately clinical care, into an entirely new paradigm. In this new world, we become personally responsible for monitoring our bodies, noticing deviations from trends, and making appropriate changes. Use of this paradigm will allow us to avoid many of today's chronic disease states. In coming decades, the new model will be "maintenance of wellness" rather than "treatment of chronic illness." My personal quest is just one of many early experiments to try to understand the future outlines of this digitally transformed world.
Footnotes [1] The California Institute for Telecommunications and Information Technology, which I founded and direct, has many projects in this area. See www.calit2.net/research/health_thrust.php.
[2] See, for instance, www.patientslikeme.com.
[3] I am following pioneers like David Ewing Duncan, the "Experimental Man" (www.davidewingduncan.com). See also the many people engaged through https://quantifiedself.com/.
[4] "Prevalence and Trends in Obesity Among US Adults, 1999-2008," Journal of the American Medical Association, 303, 235-241 (2010).
[5] I recommend that everyone take the time to watch the dramatic animation of obesity maps of the U.S., year by year, 1985-2010: www.cdc.gov/obesity/data/trends.html.
[6] One of the best books I have read on this is The Anti-Aging Zone, by Barry Sears.
[7] www.xconomy.com/san-diego/2010/05/12/how-internet-pioneer-larry-smarr-lost-20-pounds-by-becoming-a-quantified-self.
[10] You can download the short note at: https://lsmarr.calit2.net/repository/LS_reading_recommendations_FiRe_2011.pdf.
[11]See www.thedailybeast.com/newsweek/2009/06/26/a-doctor-s-vision-of-the-future-of-medicine.html as well as Sally Anderson's write-up of Lee Hood's remarks at FiRe 2011 (***SNS***: "FiRe 2011 in Review: Part III": 'How Systems Medicine and Emerging Technologies Will Transform Healthcare'; Strategic News Service, vol. 14, issue 23 (June 2011).
[12] Either through my HMO or by using the online www.yourfuturehealth.com (YFH) process. Because insurance covers only a subset of these tests, my out-of-pocket expenses for these tests are in excess of $5,000/year.
[13] See Fantastic Voyage: Live Long Enough to Live Forever, by Ray Kurzweil and Terry Grossman (2004).
[14] https://en.wikipedia.org/wiki/Eicosanoid; See also reference 6.
[15] See for instance the chart in https://fanaticcook.blogspot.com/2009/04/omega-6-and-omega-3-in-foods.html.
[16] There are a variety of sources for these, including stores like Whole Foods or specialized pharmacies. What you want to check for in fish-oil pills reduced from fish are the levels of mercury or other impurities. Pharmaceutical fish-oil pills are purified and should only contain EPA and DHA.
[17] Based on "n-3 polyunsaturated fatty acids, fatal ischemic heart disease, and nonfatal myocardial infarction in older adults: the Cardiovascular Health Study," Lemaitre et al., Am. J. Clin. Nutr., 77, 319-325 (2003). Graphics from www.anne-marie.ca/ratiokits.
[18] https://en.wikipedia.org/wiki/Omega-3_fatty_acid. EPA is eicosapentaenoic acid, DHA is docosahexaenoic acid, and ALA is alpha-linolenic acid.
[19] Omega Rx Zone: The Miracle of the New High-Dose Fish Oil (2004), by Barry Sears. See also www.drsears.com/DesktopModules/EngagePublish/printerfriendly.aspx?itemId=68&PortalId=6.
[21] "High Ratio of Triglycerides to HDL-Cholesterol Predicts Extensive Coronary Disease," Protasio Lemos da Luz, et al. Clinics, 63, 427-432 (2008).
[24] "C-reactive protein: a critical update," Mark B. Pepys and Gideon M. Hirschfield, J. Clinical Investigation, 111, 1805-1812 (2003).
[25] Note that in Figures 10, 11, 12, 14, and 15, I have graphed 10x the actual value of my CRP in mg/L in order to compare it directly with other blood markers.
[26] See, for instance, https://my.clevelandclinic.org/heart/services/tests/labtests/crp.aspx.
[27] See, e.g., the chart in www.health.harvard.edu/newsweek/Inflammation_information.htm.
[28] I use the comprehensive stool test from Your Future Health, which takes just a few minutes in the privacy of your own bathroom: www.yourfuturehealth.com/csa_information.htm.
[30] "Fecal Lactoferrin Is a Sensitive and Specific Marker in Identifying Intestinal Inflammation," S.V. Kane, W.J. Sandborn, et al., Amer. J. Gastro., 98, 1309-1314 (2003); "Review article: biological activity markers in IBD," D. Desai, W.A. Faubion, & W.J. Sandborn, Aliment. Pharm. & Ther., 25, 247-255 (2007).
[31] For an overview on IBD, see https://en.wikipedia.org/wiki/Inflammatory_bowel_disease.
[32] My data also fits a potential third subclass of IBD: segmental colitis with diverticulosis (SCAD), a fairly rare syndrome (seen in one out of 300-500 colonoscopies), in which the inflammation is confined to the sigmoid colon (as mine is) and occurs in older people, 30%-50% of whom have diverticular disease. See Hugh James Freeman, World J Gastroenterol., 14, 6442-3 (2008). Whether SCAD is a separate category or simply characterizes what happens when older people with diverticular disease develop late-onset IBD is still in discussion in the literature. My colonoscopist who took the photos in Fig. 13 believed I might have SCAD, but not full-blown IBD. I thank Dr. Zachary Jacobs for bringing SCAD to my attention as a possible explanation for my condition in February 2011.
[33] "Serial fecal lactoferrin measurements are useful in the interval assessment of patients with active and inactive IBD," T. R. Walker, M. L. Land, T. M. Cook, W. Sandborn, et al., J., DDW 2004, New Orleans, LA (www.techlab.com/docs/posters/s1423_print.pdf).
[34] "Relationship between fecal lactoferrin and inflammatory bowel disease," J. Dai, W.Z. Liu, Y.P. Zhao, Y.B. Hu, Z.Z. Ge, Scand J Gastroenterol. 42, 1440-4 (2007).
[35] "Crohn's disease initially diagnosed after age 60 years," Hugh J. Freeman, Age and Ageing, 36, 587-589 (2007).
[37] From www.23andme.com on the rs1004819 SNP: "The IL23R gene encodes part of a protein that acts as the receptor for the growth factor interleukin-23 (IL-23). Immune cells release growth factors like IL-23 when they mount an attack against an invader. Specifically, IL-23 promotes inflammation by binding to the protein encoded by IL23R. Turning on IL-23 in mice causes widespread inflammation, including in the intestines, and the gene is required for the progression of immune-related disease in mouse models." Citations: "A genome-wide association study identifies IL23R as an IBD gene," R. H. Duerr et al., Science 314, 1461-1463 (2006); "rs1004819 is the main disease-associated IL23R variant in German Crohn's disease patients," J. Glas, et al., PLoS ONE 2(9):e819 (2007).
[39] "IL-23: a master regulator in Crohn's disease," Markus Neurath, Nature Medicine, 13, 26-28 (2007); "IL-23 and autoimmunity: new insights into the pathogenesis of IBD," Clara Abraham & Judy Cho, Ann. Rev. Medicine, 60, 97-110 (2009).
[40] "Anti-IL-12/23: the next big thing in IBD?," W.J. Sandborn, et al., Inflamm. Bowel Dis. 15, 1927-8 (2009).
[41] See e.g. the discussion in https://en.wikipedia.org/wiki/Crohn%27s_disease.
[42] You should consult an expert on whether this might be beneficial for you, but if you want to find VSL-3, go to www.vsl3.com.
[43] "VSL#3 probiotic-mixture induces remission in patients with active ulcerative colitis," Rodrigo Bibiloni, et al., Am. J. Gastroenterol., 100, 1-8 (2005).
[44] "Diversity of the Human Intestinal Microbial Flora," Paul B. Eckburg et al., Science, 308, 1635-8 (2005).
[45] "Reduced diversity of faecal microbiota in Crohn's disease revealed by a metagenomic approach," C Manichanh, et al., Gut, 55:205211 (2006).
[46] See e.g. Forbes, https://blogs.forbes.com/sciencebiz/2010/06/03/your-genome-is-coming.
[47] "Metagenomic analysis of the human distal gut microbiome," Steven Gill, et al., Science, 312, 1355-1359 (2006).
[48] "A human gut microbial gene catalogue established by metagenomic sequencing," Junjie Qin, et al., Nature 464, 59-65 (2010).
[49] Alcamo's fundamentals of microbiology: Body systems edition, Jeffrey C. Pommerville (2009).
[50] "The role of microbes in Crohn's disease," PB Eckburg and DA Relman, Clin. Infect. Dis. 44, 256-62 (2007).
[51] "The gut microbiota shapes intestinal immune responses during health and disease," June L. Round and Sarkis K. Mazmanian, Nature Reviews Immunology 9, 313-323 (2009).
[52] "Interactions Between the Host Innate Immune System and Microbes in IBD," Clara Abraham and Ruslan Medzhitov, Gastroenterology, 140, 1729-37 (2011).
Acknowledgements: I would like to thank Mary Hiller, Drew Senyei, George Church, Lee Hood, David Ewing Duncan, Karen Nelson, David Brenner, John Wooley, Sally Anderson, my family, and Calit2 staff for comments on earlier drafts. I have greatly benefited from working with the medical professionals at Scripps Clinic and UCSD, Your Future Health, and MedExpert during the course of these experiments.
Other materials: To see a video of my FiRe 2011 conversation, go to: www.stratnews.com/media/fire2011/video/May26th/Fixing_Healthcare_I/player.html. This paper is based on my invited Grand Rounds talk to UCSD School of Medicine Pediatrics Division, at Rady Children's Hospital, San Diego, CA, on September 9, 2011. For those PowerPoint presentations, see: https://lsmarr.calit2.net/presentations?slideshow=9258669.
Larry Smarr
At Calit2, Larry has continued to drive major developments in information infrastructure - including the Internet, the Web, scientific visualization, virtual reality, and global telepresence -begun during his previous 15 years as founding director of the National Center for Supercomputing Applications (NCSA). His views have been quoted in Science, Nature, the New York Times, the Wall Street Journal, Time, Newsweek, Wired, Fortune, BusinessWeek, and the Sydney Morning Herald.
Larry is currently principal investigator of the Moore Foundation's CAMERA project and co-principal investigator on NSF's GreenLight project. He is a member of the National Academy of Engineering, as well as a Fellow of the American Physical Society and the American Academy of Arts and Sciences. In 2006, he received the IEEE Computer Society Tsutomu Kanai Award for his lifetime achievements in distributed computing systems. Larry is a member of the SNS Future in Review (FiRe) advisory board, and Calit2 operates as the FiRe Lab.
Larry's personal interests include orchids and coral reefs, quantifying the state of his body, and researching the details of the global energy system and the global climatic disruption it is causing. You can follow him at https://twitter.com/lsmarr and on his life-streaming portal at https://lsmarr.calit2.net.
Copyright 2011 Strategic News Service and Larry Smarr. Redistribution prohibited without written permission.
I want to thank Larry for the intense effort he has dedicated to the creation of this extended piece on quantified health. This work includes checking with experts around the world on state-of-the-art knowledge, and conclusions mentioned in this piece, a typical (for Larry) commitment to review by others and getting things right.
Larry's story ends with the new discovery of the important roles gut bacteria play in health. How many doctors consider this issue in looking at patients today? How many know what Larry discusses in this issue?
And this is the third major health issue generally ignored today: our bodies are a complex ecosystem, with "human" cells vastly outnumbered by viral bodies and bacteria. "Health" is achieved when all of these are balanced in kind and number something doctors know almost nothing about.
My personal experience in this issue is even more dramatic. I was able to save a family member's life a few years ago, when she suddenly lost all energy, became bedridden, and her doctor warned us that she was at death's door. I looked into the case and found out that she had been taking contra-indicated drugs and that her doctor had just put her on antibiotics for a cold. I figured that by killing off her gut bacteria, he had doubled the effective dose of these meds, making them even more toxic. Result: instead of dying, a new doctor took her off all meds, and she was back on her feet in two days, and lived for most of another decade.
Faced with a healthcare system that is financially out of control, and scientifically living on the margins, today's healthcare target is as often victim as patient: about half of those who die in U.S. hospitals, when necropsied, turn out to have been killed by something completely different from that for which they were being treated.
It is time for us to take responsibility for our own health, as Larry has described so compellingly in this issue.
While his efforts and skills may seem unachievable to many, just starting on this path will have immediate and beneficial results. And, who knows? Maybe we can drag the healthcare system along with us, into this new age of digital genomics, "evidence-based" medicine, and quantified health.
My thanks again to Larry, and to Editor-in-Chief Sally Anderson for another fine effort and result.
Your comments are always welcome.
Sincerely,
Mark R. Anderson CEO
____
Dear SNS Member,
Two important graphics were inadvertently dropped from the opening pages of this week's SNS Special Letter, by guest author Larry Smarr. We deeply regret our error, which has been corrected in this version.
Sincerely,
Sally Anderson Editor-in-Chief
Editor-in-Chief
____
» SNS Opportunities and Licenses
To arrange for a speech by Mark Anderson on subjects in technology and economics, or to schedule a strategic review of your company, email mark@stratnews.com.
For inquiries about Sponsorship Opportunities and/or SNS Events, please contact Sharon Anderson-Morris ("SAM"), SNS Programs Director, at sam@stratnews.com or 435-649-3645.
If SNS is a competitive weapon, shouldn't all of your employees have it? Email David Morris at david@stratnews.com for details on SNS Site Licenses.
Waldorf=Astoria Hotel:
www.stratnews.com/newyork/2011
featuring a Centerpiece Conversation with member Robert Hormats, Under Secretary of State for Economic, Energy and Agricultural Affairs, on the subject:
"How Intellectual Property Drives the Global Economy."
Those of you who have been tuned in to Secretary Clinton's comments on Protecting IP will want to talk with Bob and get his personal read on their recent travels to China.
We will also have an additional (returning) special guest with us:
Richard Marshall, Director of Global Cyber Security Management, Department of Homeland Security, to help us continue our conversation on security.
Bring a friend for $195! Invite up to three non-SNS members to join you. Friends of SNS Predictions Dinner attendees can take advantage of this offer by using the host's email address in the invitation code box when registering at: www.stratnews.com/newyork.
Register now for FiRe X, the 10th annual Future in Review conference, May 22-25, 2012, at the Montage Laguna Beach Hotel, California:
» SNS Media
"SNS iNews is a terrific idea." Peter Petre, Author and Past Sr. Editor, FORTUNE magazine
Use SNS iNews to stay in touch, in real time, with what your fellow members and FiRe Thought Leaders are achieving and then help them get there.
Click here for the current iNews digest: www.snsinews.com (For ID and password assistance, email scott@stratnews.com)
Site Sales by Commission. This person (or company) will join a team that continues our nearly 100% success rate in offering site licenses for the SNS newsletter to large companies. Current license holders include: Deloitte, Accenture, Deutsche Telekom, Internode Pty, Accenture's Global CIO Forum, and Adobe. Generous commissions available. Please send a cover letter and bio/resume to Sharon Anderson-Morris at sam@stratnews.com.
(All rates $USD)
If you are not currently an SNS subscriber, the SNS newsletter has been sent to you for a one-month trial. If you would like a one-year subscription to SNS, the current rate is $595, which includes approximately 48 issues per year, plus special industry alerts and related materials. Premium Subscriptions, which include passworded access to additional materials on the SNS website, are $895 per year. Subscriptions can be purchased, upgraded, or renewed at our secure website, at www.stratnews.com. Contact Jennifer Lee, jenny@stratnews.com, for subscription assistance.
UPGRADE YOUR SUBSCRIPTION TO PREMIUM LEVEL for $300 per year, and enjoy email access to our FiRe Conference speakers through our new service, SNS Interactive News (SNS iNews), along with other Premium benefits. After logging in to your Account, go to: www.tapsns.com/orders/?page=account.
VOLUME CORPORATE SUBSCRIPTION RATES: More than half-price savings, for up to 10 members: $2950. Additional members: $295.
SMALL COMPANY SITE LICENSE (for companies with fewer than 10 employees): Deep discount (far less than half price), for up to 10 members: $1495. Additional members: $295.
TEACHERS' GROUP RATE (five teachers): $295.
STUDENT and INDEPENDENT JOURNALIST RATE: $295 per year.
» May I Share This Newsletter?
If you are aware of others who would like to receive this service, please forward this message to them, with a cc: to Mark Anderson at sns@stratnews.com; they will automatically receive a free one-month pilot subscription.
ANY OTHER UNAUTHORIZED REDISTRIBUTION IS A VIOLATION OF COPYRIGHT LAW.
» About the Strategic News Service
SNS is the most accurate predictive letter covering the computer and telecom industries. It is personally read by the top managers at companies such as Intel, Microsoft, Dell,
HP, Cisco, Sun, Google, Yahoo!, Ericsson, Telstra, and China Mobile, as well as by leading financial analysts at the world's top investment banks and venture capital funds, including Goldman Sachs, Merrill Lynch, Kleiner Perkins, Venrock, Warburg Pincus, and 3i. It is regularly quoted in top industry publications such as BusinessWeek, WIRED, Barron's, Fortune, PC Magazine, ZDNet, Business 2.0, the Financial Times, the New York Times, the Wall Street Journal, and elsewhere.
Email sent to SNS may be reprinted, unless you indicate that it is not to be.
» About the Publisher
Mark Anderson is CEO of the Strategic News Service. He is the founder of two software companies and of the Washington Technology Industry Association "Fast Pitch" Forum, Washington's premier software investment conference; and has participated in the launch of many software startups. He regularly appears on the CNN World News, CNBC and CNBC Europe, Reuters TV, the BBC, Wall Street Review/KSDO, and National Public Radio programs. He is a member of the Merrill Lynch Technology Advisory Board, and is an advisor and/or investor in OVP Ventures, Ignition Partners, Mohr Davidow Ventures, the UCSD Calit2 Laboratory, the Global Advisory Council of the mPedigree Network (Ghana), SwedeTrade, The Family Circle (Europe), and the Australian American Leadership Dialogue.
* On October 23-26, Mark will be speaking at the Compass Conference, Terranea Resort, Rancho Palos Verdes, on "Economic Cyberwar." * On November 7-9, he will be speaking at the Accenture Annual meeting in Berlin, on "Economic Cyberwar and Valuing Intellectual Property." * Save the date for the 7th Annual SNS Predictions Dinner at the Waldorf=Astoria, New York, December 8, 2011, where Mark will have a Centerpiece Conversation with Robert Hormats, Under Secretary of State for Economics, Energy and Agricultural Affairs, on the question of "How IP Drives the Global Economy"; followed by a talk in which Mark will share his views on the economic landscape, and his Top Ten Technology Predictions for 2012, with a general audience discussion to follow. Bring your own questions about the coming year, and register at www.stratnews.com/newyork/2011. * On May 22-25, 2012, Mark will be be hosting FiRe X, the 10th annual Future in Review Conference, at the Montage Laguna Beach. Sign up now for a fraction of retail, at www.futureinreview.com.
Copyright 2011, Strategic News Service LLC.
"Strategic News Service," "SNS," "Future in Review," "FiRe," and "SNS Project Inkwell" are all registered service marks of Strategic News Service LLC.
ISSN 1093-8494
| |||||||||||||||||||||||||||||||||||||||||||||||||||||||||||||||||||||||||||||
Recent Issuesscott2022-09-20T16:01:24-07:00
SNS: Special Letter: Quantified Health: A 10-Year Detective Story of Digitally Enabled Genomic Medicine
 Registration is now open for the 7th annual SNS Predictions Dinner, December 8, 2011, at the historic Waldorf=Astoria Hotel: