AT THE climate crossroads: crisis or catAclysm By Berit Anderson ______ Why Read: To date, the negative effects of the climate emergency have advanced in a more or less linear way, giving humans an unrealistic expectation about the future rate of change. The science around sea-level rise, Arctic ice melt, and methane release indicates that we're facing an exponential curve - a curve that will bring an ever-increasing onslaught of natural disasters, including wildfire, flood, heat waves, drought, and famine. This week's Global Report explores what to expect in the next few years, why the Intergovernmental Panel on Climate Change (IPCC) is an unreliable narrator on the topic, and how to prepare for an exponentially changing world. ______ When it comes to the climate emergency, things are already not going particularly well. Wildfires, floods, hurricanes, and tornadoes now threaten nearly every corner of the planet. Drought and water scarcity are rippling through communities around the world, creating the beginnings of mass climate migration, as moneyed interests snuffle up water and agricultural land like a Dyson vacuum cleaner. And:
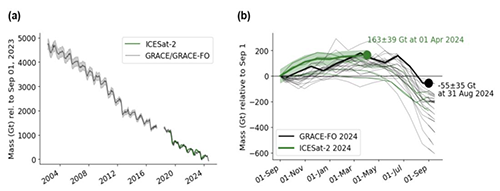
(a) Observed mass balance of the Greenland Ice Sheet over 2002-24 from GRACE/GRACE-FO (black) and 2019-24 from ICESat-2 (green), with associated uncertainties (shaded). (b) Annual mass balance for 2002-23 (GRACE/GRACE-FO, thin black lines) and 2019-23 (ICESat-2, thin green lines) with the full 2024 mass balance year (GRACE-FO) and the 2024 mass balance year through 1 April (ICESat-2) in bold. (Source: NOAA in the Arctic)
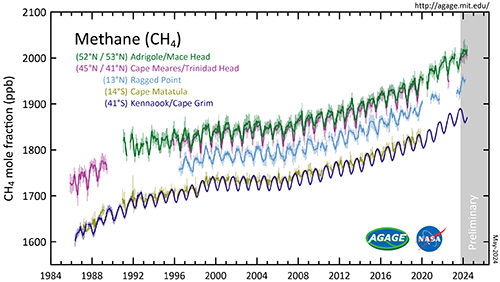
Methane (CH4) concentrations in the atmosphere measured by the Advanced Global Atmospheric Gases Experiment (AGAGE) in the lower atmosphere (troposphere) at stations around the world. Values are given as pollution free monthly mean mole fractions in parts-per-billion. According to a report by the Environmental Defense Fund, operator of the MethaneSAT satellite: The total estimated emissions across all lower-48 US basins amount to a loss rate of 2.4% across oil and gas producing regions (normalized to gross gas production), more than double the EPA Greenhouse Gas Inventory Report for natural gas and petroleum systems in 2021. Our estimates are largely in line with the results from six out of seven prior studies that predominantly used satellite-derived data from the satellites GOSAT and TROPOMI to perform inversions that determined national estimates of methane emissions from US oil and gas production, with a combined average of 13 million metric tons per year. |